How we validate the catalog
Alden Keefe Sampson
Every dataset in the dynamical.org catalog ships with an automated validation report. This note walks through what those reports check, why we chose those checks, and how they fit into the pipeline that runs each time a dataset updates. It is a living document — expect it to grow as the validation suite does.
This is the first of what we hope will be many lab notes: longer-form write-ups of the methods, experiments, and dead ends behind the catalog. Unlike our short updates, these are meant to be read once and referenced later. Treat anything marked Draft as a work in progress.
Why validate at all
A cloud-optimized archive is only useful if you can trust it. A single corrupted chunk, a silently dropped forecast hour, or an off-by-one in the regridding step can poison an analysis in ways that are hard to notice downstream.[1] Our goal is to give ourselves — and you — enough visibility into each dataset that you can build on it without re-deriving its provenance yourself.
We split validation into two layers: structural checks that run on every write, and scientific checks that compare our data against an independent reference.
What the reports check
Each catalog entry links to a validation report. For every variable, the report renders three views plus a distribution summary.
Null-fraction traces
A time series of the fraction of missing values across the archive. Gaps, ingestion stalls, and source outages show up immediately as spikes.
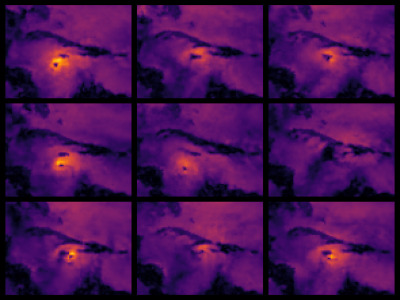
Spatial comparison
Side-by-side maps of our dataset against the reference analysis at a sampled timestamp, with a value-distribution histogram so the magnitudes are easy to sanity-check at a glance.
Point time series
Comparisons at two randomly chosen geographic points over the full archive period. Random points keep us honest: a check that always samples the same well-behaved grid cell tells us very little.
How it runs
These reports are generated automatically as part of the pipeline that updates each dataset, published to R2, and rendered into the catalog page.[2] Because they regenerate on every update, a regression surfaces in the next report rather than waiting for someone to notice a bad number.
What's next
We are backfilling reports across existing data products and expanding the scientific checks — skill scores against reanalysis, and cross-model agreement where multiple models cover the same domain. Feedback is very welcome.
The failure modes we worry about most are the quiet ones: data that looks plausible but is subtly wrong. Loud failures (a missing file, a 500 from the source) are comparatively easy to catch. ↩︎
The generation code lives in dynamical-org/reformatters; the rendered reports are served from R2 and mirrored into each catalog page. ↩︎